Quantitative Analysis of Caffeine Levels in Local Coffee (Coffea sp) Powder on Dabo Island with UV-Vis Spectrophotometry Array

Article Sidebar
-
Coffee powder, Caffeine, UV-Vis Spectrophotometry
Abstract
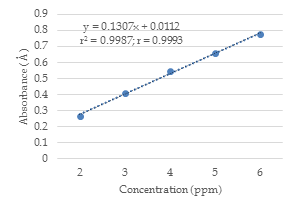
Coffee (Coffea sp) is the second-largest beverage consumed by people around the world whose process comes from the processing and extraction of coffee beans. Coffee has a chemical compound, one of which is caffeine. Caffeine is a crystal-shaped compound. Caffeine can be a tangible white powder or a shiny white needle-shaped, odorless caffeine, and caffeine has a bitter taste. The purpose of the study was to determine the caffeine levels of local ground coffee on the island of Dabo with the spectrophotometry UV-Vis method. Analysis of the ground coffee caffeine levels is quantitative determined using spectrophotometry UV-Vis. The equation of the calibration curve of caffeine is regression y = 0.1307x + 0.0112 with a correlation coefficient value (r) of 0.9993. Based on Indonesian National Standards (SNI) 01-7152-2006, The maximum limit of caffeine in foods and beverages is 150 mg/day and 50 mg/serving. The results of the analysis of caffeine levels from three samples of ground coffee circulating on Dabo Island each in 2 g were 0.3383 mg for Sample A; 0.3786 mg for Sample B; and 0.5803 mg for Sample C.
Full text article
References
Aptika, N.M.D., Tunas, I.K., Sutema, I.A.M.P. 2015. Analisis kadar kafein pada kopi hitam di bukian gianyar menggunakan spektrofotometer UV-Vis. Jurnal Chemistry Laboratory. 2(1):30-37.
Arwangga, A.F., Asih, I.A.R.A., Sudiarta, I.W. 2016. Analisis Kafein pada Kopi di Desa Sesaot Narmada Menggunakan Spektrofotometri UV-Vis. Jurnal Kimia (Journal of Chemistry). 10(1):110-114.
Bewick, V., Cheek, L., Ball, J. 2003. Statistics review 7: Correlation and regression. Critical Care. 7(6):451-459. https://dx.doi.org/10.1186/cc2401
Bhawani, S.A., Fong, S.S., Ibrahim, M.N.M. 2015. Spectrophotometric Analysis of Caffeine. International Journal of Analytical Chemistry. 2015:170239. https://dx.doi.org/10.1155/2015/170239
Cornelis, M.C. 2019. The Impact of Caffeine and Coffee on Human Health. Nutrients. 11(2):416. https://dx.doi.org/10.3390/nu11020416
Fajara, B.E.P., Susanti, H. 2017. HPLC determination of caffeine in coffee beverage. IOP Conference Series: Materials Science and Engineering. 259(2017):012011. https://doi.org/10.1088/1757-899X/259/1/012011
Gaascht, F., Dicato, M., Diederich, M. 2015. Coffee provides a natural multitarget pharmacopeia against the hallmarks of cancer. Genes & Nutrition. 10(6):51. https://dx.doi.org/10.1007/s12263-015-0501-3
Grgic, J. Trexler, E.T., Lazinica, B., Pedisic, Z. 2018. Effects of caffeine intake on muscle strength and power: a systematic review and meta-analysis. Journal of the International Society of Sports Nutrition. 15:11. https://dx.doi.org/10.1186/s12970-018-0216-0
Khoshneviszadeh, R., Bazzaz, B.S.F., Housaindokht, M.R., Ebrahim-Habibi, A., Rajabi, O. 2015. UV Spectrophotometric Determination and Validation of Hydroquinone in Liposome. Iranian Journal of Pharmaceutical Research. 14(2):473-478.
Maramis, R.K., Citraningtyas, G., Wehantouw, F. 2013. Analisis Kafein dalam Kopi Bubuk di Kota Manado Menggunakan Spektrofotometri UV-Vis. Pharmacon. 2(4):122-128.
Pasalic, D., Marinkovic, N., Feher-Turkovic, L. 2012. Uric acid as one of the important factors in multifactorial disorders – facts and controversies. Biochemia Medica. 22(1):63-75. https://doi.org/10.11613/BM.2012.007
Reyes, C.M., Cornelis, M.C. 2018. Caffeine in the Diet: Country-Level Consumption and Guidelines. Nutrients. 10(11):1772. https://dx.doi.org/10.3390/nu10111772
Temple, J.L., Bernard, C., Lipshultz, S.E., Czachor, J.D., Westphal, J.A., Mestre, M.A. 2017. The Safety of Ingested Caffeine: A Comprehensive Review. Frontiers in Psychiatry. 8:80. https://dx.doi.org/10.3389/fpsyt.2017.00080
Wassef, B., Kohansieh, M., Makaryus, A.N. 2017. Effects of energy drinks on the cardiovascular system. World Journal of Cardiology. 9(11):796-806. https://dx.doi.org/10.4330/wjc.v9.i11.796
Wilson, C. 2018. The clinical toxicology of caffeine: A review and case study. Toxicology Reports. 5:1140-1152. https://dx.doi.org/10.1016/j.toxrep.2018.11.002
Authors
Copyright (c) 2019 Sri Hainil, Suhaera Suhaera, Lirtri Lirtri

This work is licensed under a Creative Commons Attribution-ShareAlike 4.0 International License.
This work is licensed under a Creative Commons Attribution-ShareAlike 4.0 International License.
Authors continue to retain the copyright to the article if the article is published in the Borneo Journal of Pharmacy. They will also retain the publishing rights to the article without any restrictions.
Authors who publish in this journal agree to the following terms:
- Any article on the copyright is retained by the author(s).
- The author grants the journal the right of first publication with the work simultaneously licensed under a Creative Commons Attribution License that allows others to share work with an acknowledgment of the work authors and initial publications in this journal.
- Authors can enter into separate, additional contractual arrangements for the non-exclusive distribution of published articles (e.g., post-institutional repository) or publish them in a book, with acknowledgment of their initial publication in this journal.
- Authors are permitted and encouraged to post their work online (e.g., in institutional repositories or on their websites) prior to and during the submission process. This can lead to productive exchanges and earlier and greater citations of published work.
- The article and any associated published material are distributed under the Creative Commons Attribution-ShareAlike 4.0 International License.
Article Details